

How Probability Models Help Us Understand the World by Sam Broverman, PhD, ASA (Part 2)
Written by Sam Broverman, PhD, ASA
One of the objectives of science is to create models that describe, if not explain, observed phenomena. Around 150 CE, the Greek astronomer Ptolemy created a geocentric model of the solar system that required complicated assumptions of the movements of the Sun and the then observable planets to accurately describe and predict where they would appear in the sky at any particular time. It was a very accurate model and was widely accepted for many years. It was also a model that required the Sun and planets to move in very complicated ways to account for their positions in the sky. Astronomers in the Renaissance era, such as Copernicus and Galileo, developed models for the solar system that were much simpler than and just as accurate as those of Ptolemy. Furthermore, the newer models were consistent with the theory of force and motion developed by Newton, whereas Ptolemy’s model was not consistent with that theory. As time went on, more observations as well as experimental evidence created a stronger and stronger case for the acceptance of the newer theory (in spite of interference from some religious leaders who preferred Ptolemy’s geocentric theory).
Ptolemy collected data, such as the positions of the Sun and planets at various points in time, and created his model based on that data. Copernicus, Galileo, and others also collected data but observed patterns in that data that Ptolemy missed or ignored. Ptolemy’s model required the Earth to be stationary and all other celestial objects to orbit around the Earth. The analysis of the later astronomers indicated that smaller celestial objects tended to orbit around larger ones, in particular, the moon around the Earth and the Earth and other planets around the Sun, and that this was also consistent with behavior predicted in Newton’s laws of motion. Models can be improved not only as a result of having additional data but also as a result of more careful analysis of the factors generating the data
The models of the solar system discussed in the previous two paragraphs are deterministic models. These are models for which an outcome is entirely predictable. There is no (or very little) uncertainty in the predicted positions of the Sun and planets. There is the possibility that a previously unobserved object, such as a comet, will appear, and then the predictions of positions in the sky of the various objects may have to be altered. The appearance of a comet would be a “random” (in the sense of unpredictable) event. We could, however, over time, collect data on the nature of the appearance of such objects, such as when and where they appeared, what size they are, etc. We could use the observed data to try to create a model for when such objects appear and how large they are, and use that information to modify predictions already made.
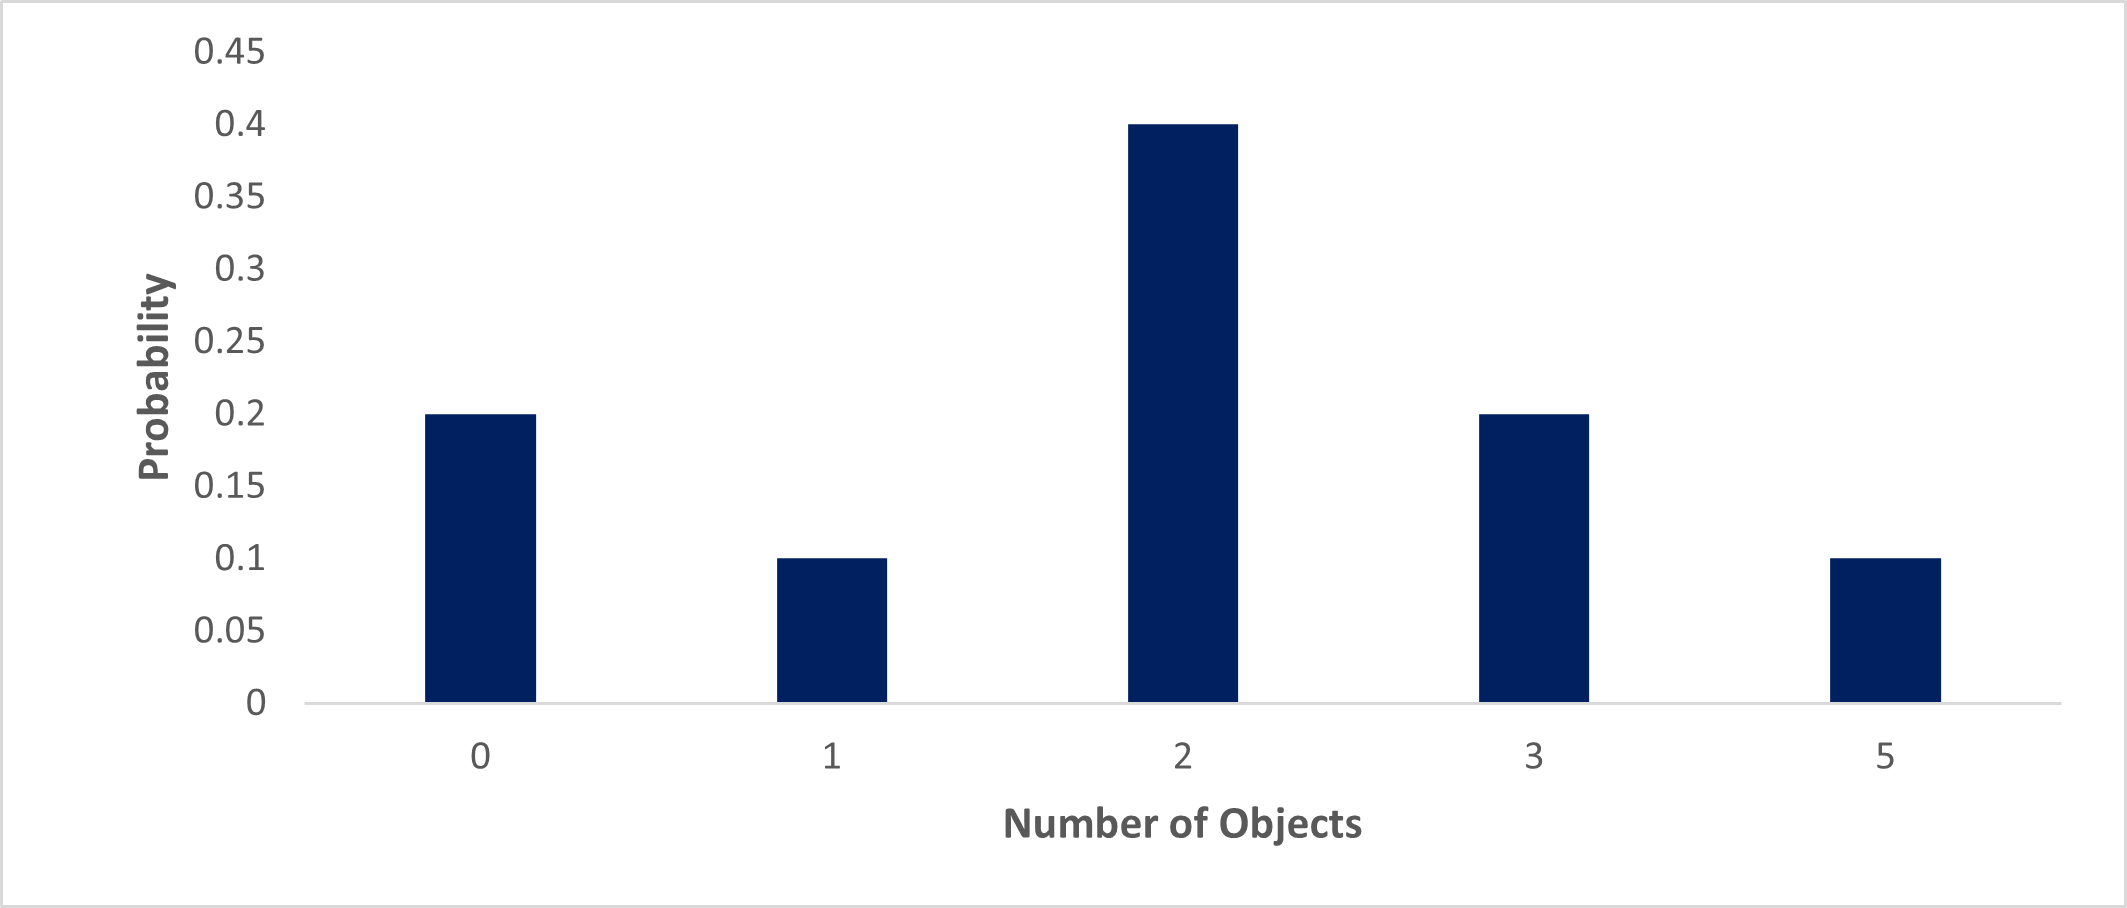
The model of when, where it appears, and how large the new object is would not be a deterministic model, as we don’t know in advance when and where objects will appear and how large they will be, but we can use data collected to describe those phenomena. We might observe twenty such objects appearing over a ten-year period. We could create a simple model that states that two objects appear per year. It might well be the case that in some years there were no objects appearing, and in some years there are more than two appearing, and therefore it is more appropriate to create a probabilistic model that allows for variability in the number of objects appearing per year. Suppose that the observed data is as follows. Over the ten-year period, there were two years with no objects observed, one year with one object, four years with two objects, two years with three objects, and one year with five objects. One simple probabilistic model based on the observed data is that in any particular year, there will be a 0.2 (two in ten years) probability of no objects appearing, a 0.1 probability of one object, and a 0.4 probability of two objects. 0.2 probability of three objects and 0.1 probability of five objects. This model simply reflects the observed data.
| # of Objects | # of Years | Probability of relative # of objects appearing in any given year |
|---|---|---|
| 0 | 2 | 2/10 = 0.2 |
| 1 | 1 | 1/10 = 0.1 |
| 2 | 4 | 4/10 = 0.4 |
| 3 | 2 | 2/10 = 0.2 |
| 5 | 1 | 1/10 = 0.1 |
| Total | 10 | 1 |
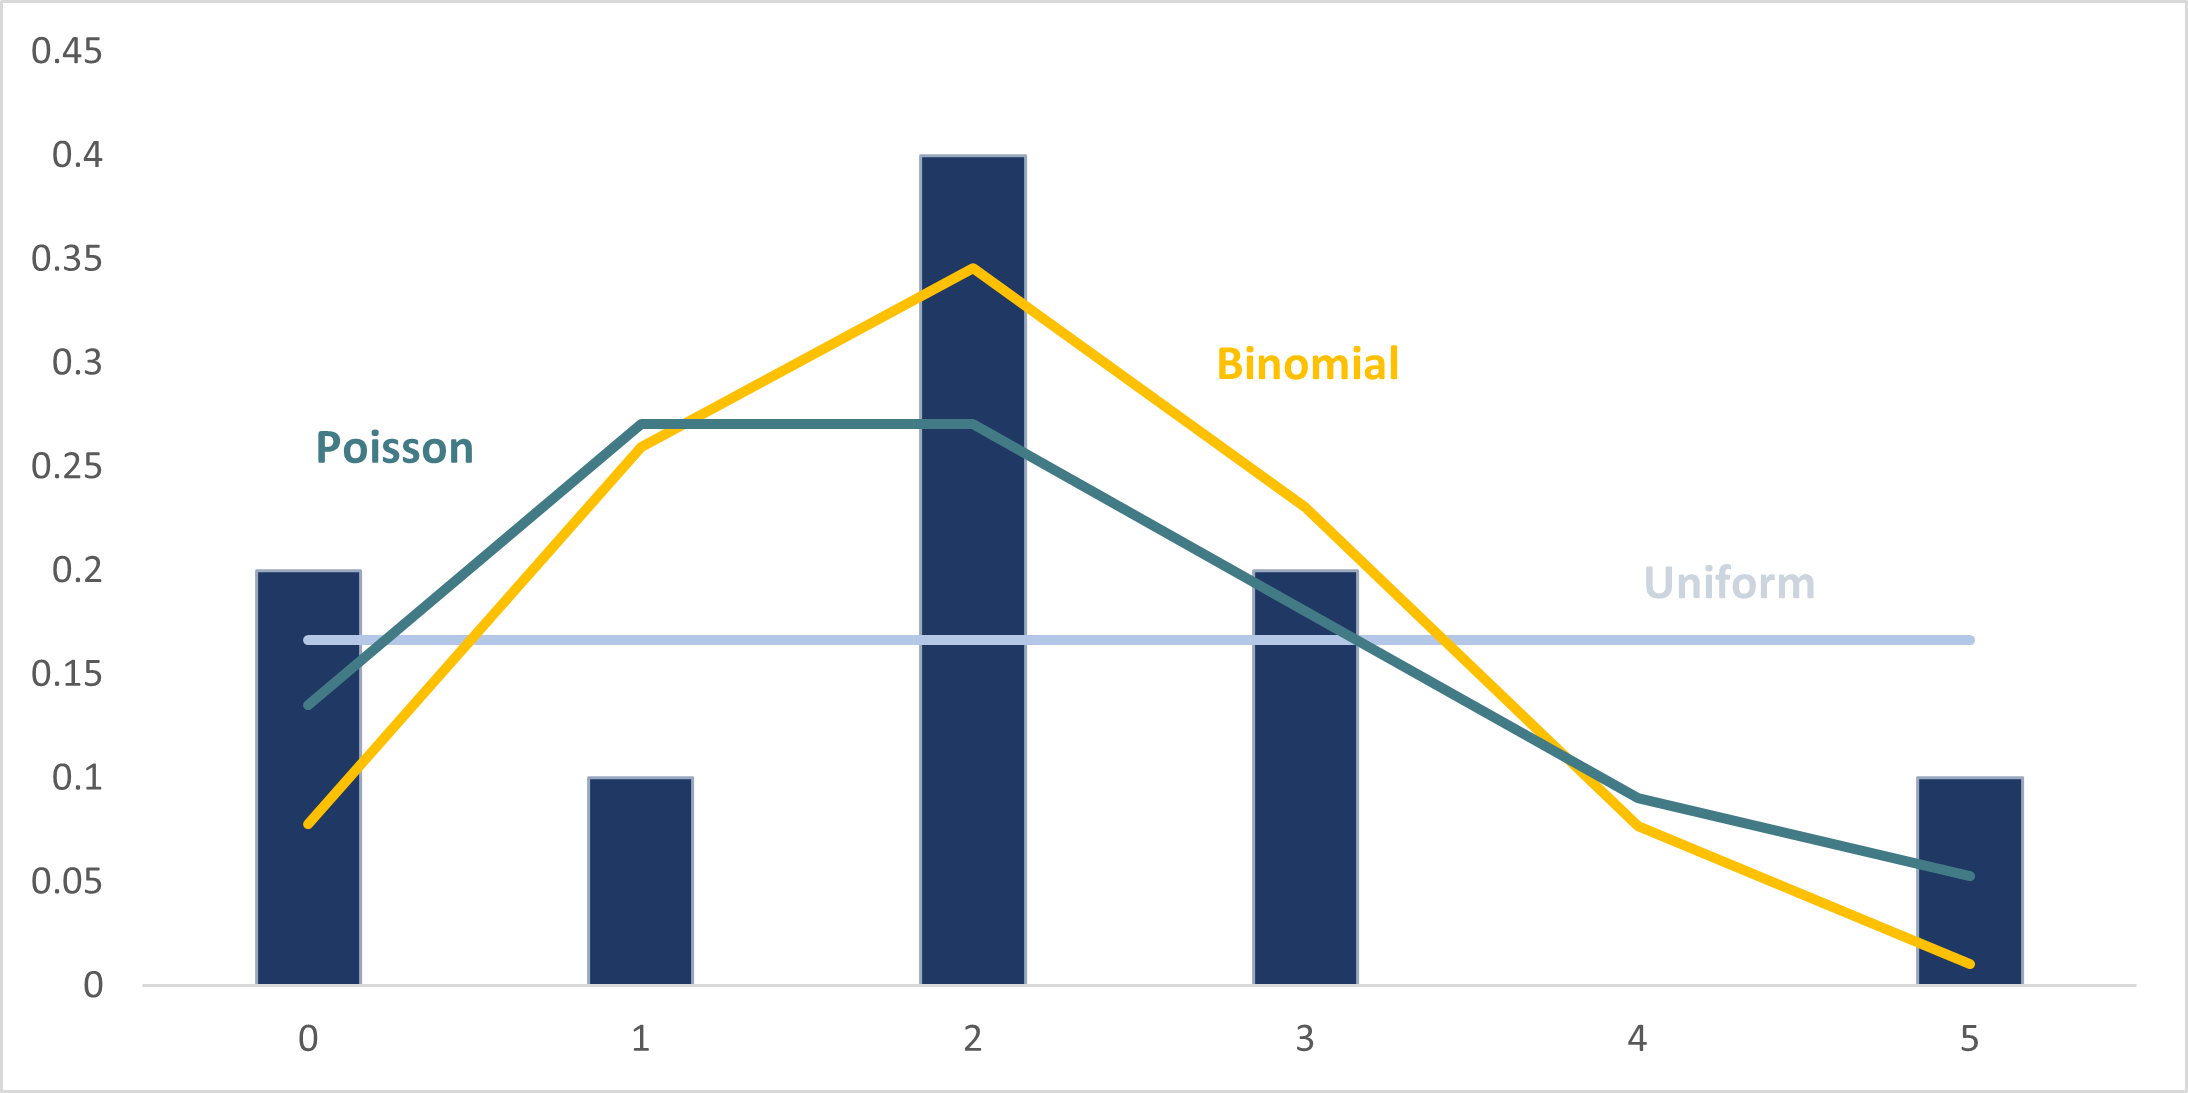
This probabilistic model describing the appearance of a previously unobserved celestial object will not be very accurate for prediction purposes. It would never predict a year with four objects and it would never predict a year with more than 5 objects although it seems well within the realm of possibility that there will be such years. There are a number of simple probability models (distributions) that could be used to try to describe the observed data that would include the possibility of a year with four or more than five objects.
Readers familiar with some simple discrete integer valued probability distributions will know the uniform, binomial and Poisson distributions. It will be left to the reader to assess which of these probability distributions appears to be the best fit of the observed data.
| # of Objects | # of Years | Probability of relative # of objects appearing in any given year | Uniform Distribution | Binomial Distribution n = 5 p = 0.2 |
Poisson Distribution λ = 2 |
|---|---|---|---|---|---|
| 0 | 2 | 2/10 = 0.2 | 1/6 = 0.16667 | 0.07776 | 0.1353 |
| 1 | 1 | 1/10 = 0.1 | 1/6 = 0.16667 | 0.2592 | 0.2707 |
| 2 | 4 | 4/10 = 0.4 | 1/6 = 0.16667 | 0.3456 | 0.2707 |
| 3 | 2 | 2/10 = 0.2 | 1/6 = 0.16667 | 0.2304 | 0.1804 |
| 4 | 0 | 0/10 = 0.0 | 1/6 = 0.16667 | 0.0768 | 0.0902 |
| >= 5 | 1 | 1/10 = 0.1 | 1/6 = 0.16667 | 0.01024 | 0.0527 |
| Total | 10 | 1 | 1 | 1 | 1 |
Many questions arise from this simple example, such as which of the proposed models (distributions) is most appropriate or accurate, and how do we determine that? How useful are the predictions that would be made from the various models? Readers who are familiar with this subject will know that there are many tests and procedures that can be used to test the accuracy and predictability of a model.
The availability and collection of data have improved immensely in recent years. Some types of data have become more complicated in the sense that more parameters are available in that data. For instance, in the context of life insurance, the availability of genetic data will make for more accurate predictions of future health and survivability characteristics of individuals. Models to represent data become more sophisticated over time as well. As data becomes more complex, the models that use the increasingly complex data will become increasingly complex. A crucial requirement in the actuarial profession will be a wide knowledge of possible models and how to use data to calibrate them, test them, and make meaningful predictions with them.
Share This:


